
There is a number that development finance organizations report confidently and that means almost nothing: price per beneficiary. It tells you how much was spent divided by how many people passed through a program. It does not tell you whether anything changed for any of them.
I recently spoke with Amel Karboul, CEO of the Education Outcomes Fund (EOF), and she walked me through a specific case that shows how large the gap between those two things can be. A government ran a subsidized employment scheme for 100,000 young people at a cost of hundreds of millions of dollars. The program was considered a success. Participants received training, were placed with employers who got subsidies to hire them, and the completion rate was high. Then someone checked how many participants were still employed one year after the subsidies ended. The answer was 15%.
“Your price per outcome is those hundreds of millions divided by the 15%, not by the hundred thousand,” Karboul said. “When you make that calculation, you could have sent each one of them to Harvard.”
That is not an obscure failure. It is roughly what the evidence shows happens regularly in development programming.
The Metric That Hides Failure
The World Bank’s Global Education Evidence Advisory Panel, convened in part by the Gates Foundation and others, reviewed hundreds of education interventions and found that a significant portion had no measurable impact on learning outcomes. A meta-analysis by researcher Patrick McEwan, referenced by the World Bank’s impact evaluation blog, found that only about 10% of evaluated education programs tracked impact more than a month after the program ended. Most simply reported participation numbers.
The price-per-beneficiary framing did not emerge from cynicism. It came from a genuine need to compare across diverse programs, and at low enough price points it can signal efficiency. But it measures throughput, not transformation. A program that spends $5 on each of five million children and changes nothing for any of them looks, in that ledger, like an efficient program.
The global scale of this problem is significant. The World Bank estimates that 70% of 10-year-olds in low- and middle-income countries cannot read and understand a simple text, a figure the Bank calls “learning poverty.” This has persisted through decades of increased enrollment and increased spending. More children are in school than at any point in history, and more of them are failing to learn than the enrollment figures suggest.
Money is part of the problem, but not in the way most funding discussions frame it. The UNESCO GEM Report puts the annual financing gap to meet SDG 4 targets at $97 to $100 billion. That gap is real. But the record of existing spending suggests that closing the financing gap will not, by itself, close the learning gap. The problem is not only how much is spent. It is on what basis payment is released.
What Happens When You Price the Outcome Instead
EOF’s model is built around a different question: what does it actually cost to produce a specific, verified result? In practice, answering that requires knowing things most education systems do not track. The baseline learning levels of children before an intervention. The counterfactual trajectory without it. The actual measured change attributable to the program. Building that data infrastructure is expensive and time-consuming, and EOF describes it as one of the hardest parts of structuring a new program.
“The world normally knows a price per intervention, or a price per beneficiary,” Karboul said. “The world doesn’t know what a price per outcome is.”
The UK is one of the few countries with reasonably developed outcome pricing across social programs, with estimates for costs like youth unemployment and homelessness that allow outcomes-based contracts to be structured around measurable savings or gains. EOF is working with AI tools to build similar infrastructure across the countries where it operates, tracking the expected cost trajectory of a child who is, in Karboul’s words, “developmentally on track at age five, learning at ten, employed at twenty.”
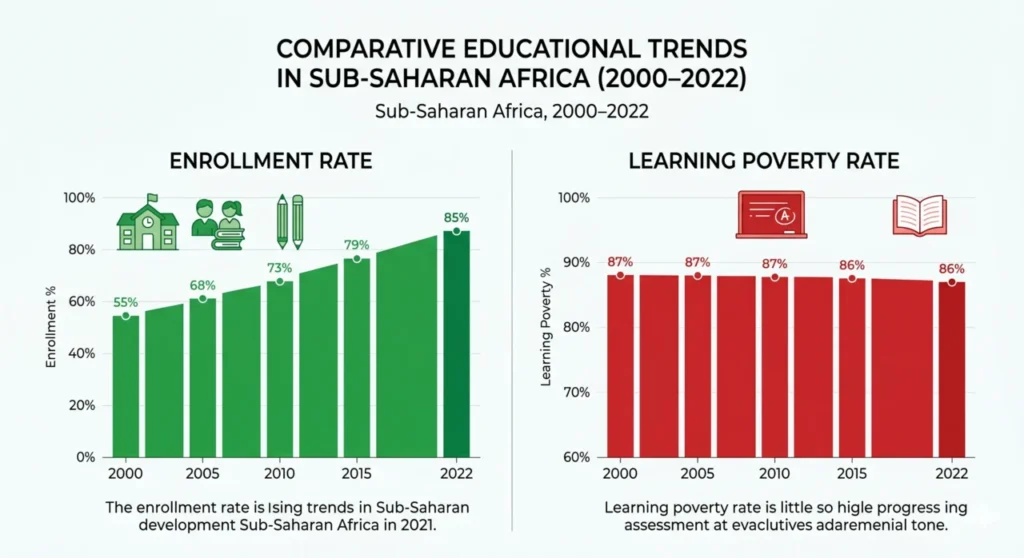
“Enrollment numbers have risen steadily across low-income countries, but learning poverty rates tell a different story about what those numbers mean.”
Source: World Bank Learning Poverty Global Database; UNESCO Global Education Monitoring (GEM) Report.
In Sierra Leone, where EOF ran its first completed program, that infrastructure supported an $18 million intervention across 325 primary schools and approximately 134,000 children. Five implementing partners worked in parallel, each using different approaches, across different districts. The common thread was the outcome metric: children’s scores on standardized literacy and numeracy assessments, measured by an independent evaluator through a randomized control trial (RCT).
The outcome pricing for girls was explicitly adjusted. Providers received a 20% premium for closing the gender gap in learning results, not for enrolling girls, but for producing measured improvements in what they learned. By Year 3, girls had nearly caught up with boys in both literacy and numeracy. EOF is now applying a similar pricing premium in Rwanda for children with disabilities, paying double the standard rate for each child with a disability who is enrolled and learning. This came after discovering that most early childhood centers in their program areas had initially reported zero children with disabilities, a figure that was obviously wrong.
The Quality Education India Development Impact Bond, documented by the Government Outcomes Lab at Oxford, provides another example of outcome-priced contracts working at scale. Across multiple states, the DIB produced significant improvements in foundational literacy and numeracy in government schools, with payment structures tied explicitly to ASER assessment scores, a widely used third-party measure.
The RCT Question: Rigorous Measurement at Scale
RCTs are the methodological standard in outcomes-based financing, and they create real friction. They are expensive. They require baseline data collected before the program starts. They take time. The Ghana Education Outcomes Project took five years from design to launch, in part because of the complexity of establishing the measurement framework alongside the financing and contracting structure.
More recent EOF programs have compressed that timeline. The Nigeria program, launched in partnership with Lagos State, moved from first conversation to launch in under a year. Karboul attributes this to template contracts developed from earlier programs and to the organization’s growing experience with what governments need to see before committing to an outcomes contract.
There is also a genuine methodological tension in the RCT approach. Randomization works well for interventions with clear boundaries, a specific curriculum package delivered to specific schools, for example. It is harder to apply when the intervention is adaptive by design, as EOF’s programs are. Providers in Sierra Leone were told they could change their approach if something was not working. One partner shifted from a teacher-focused model to extensive community engagement after discovering children were being pulled out during harvest season. A strict RCT design would have had difficulty crediting that flexibility.
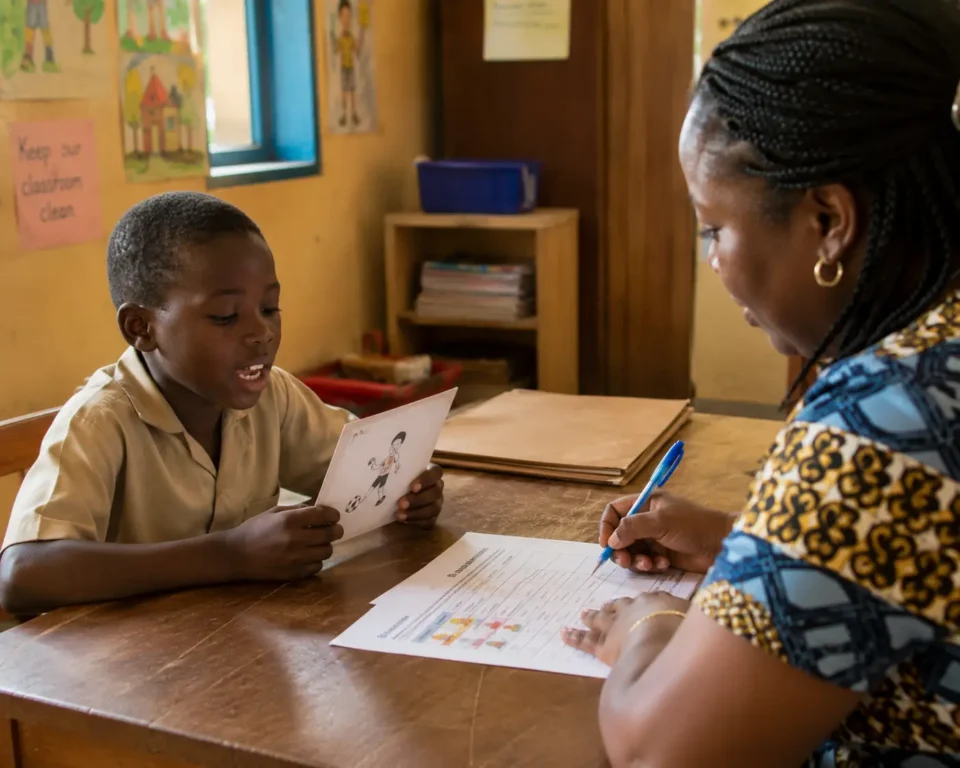
“Independent randomized control trials, conducted by third-party evaluators, are the primary verification mechanism before any outcomes payment is released.”
The Government Outcomes Lab’s INDIGO dataset tracks 320-plus impact bond contracts globally, of which 138 have been successfully completed. Across the broader SIB and DIB literature, average returns to investors have typically ranged between 3% and 10%, with outcomes achievement rates varying considerably by sector and design quality.
EOF’s methodology is documented in its own Pricing Outcomes Technical Brief, which walks through how price-per-outcome figures are established in early childhood care and education. EOF is actively sharing this with other actors in the ecosystem, including multilaterals and bilateral donors, so that every organization does not have to rebuild the pricing infrastructure from scratch.
Beyond Test Scores: What Gets Measured and What Gets Left Out
The standard critique of outcomes-based education financing is that it narrows what education is to whatever can be measured in a standardized test. You measure literacy and numeracy, the incentive flows toward literacy and numeracy, and everything else, critical thinking, creativity, social development, gets quietly deprioritized.
Karboul takes the critique seriously but draws a distinction between program areas. For foundational learning, covering children in primary school who cannot read, she is relatively untroubled by the focus on literacy and numeracy. “If the test is being able to read a paragraph, please teach to the test,” she said. “Children need to be able to read and write. That’s the foundation for everything else.”
The Sierra Leone program data supports this in a counterintuitive way. Partners measured literacy and numeracy, but what they had to actually change to move those numbers was far broader: teacher confidence, classroom safety, community attitudes toward school attendance, parental involvement. One organization reduced the proportion of children afraid to ask questions from around 90% to 20-30%. Another worked with village chiefs to stop fathers pulling sons out of school during harvest. The measured outcomes were test scores. The work behind them was a much wider transformation of the learning environment.
For early childhood programs, EOF measures social-emotional learning and process quality alongside cognitive development indicators, specifically the quality of interaction between caregivers and children, because at ages three to five, developmental outcomes cannot be reduced to a single score. The skills-to-employment programs in Tunisia measure job placement and six-month retention rates, but producing those results requires CV coaching, employer relations, mentoring, and sector-specific skills training.
The evidence base on education spending more broadly supports the idea that how money is spent matters more than how much. A World Bank analysis comparing 150 education interventions using learning-adjusted years of schooling found enormous variation in cost-effectiveness across approaches, with structured pedagogy and teacher coaching among the highest-value interventions.
The Politics of Accountability
The hardest part of outcomes-based financing is not the financial engineering or the measurement methodology. It is the political environment in which governments operate. Karboul was a minister in the Tunisian transitional government and describes firsthand what the incentive structure looks like from inside a cabinet role. Short political tenures, media cycles that reward announcements over follow-through, budget systems that penalize unspent funds and make multi-year performance commitments structurally difficult: none of these are amenable to a financing model that takes two to three years to produce its first verified outcomes.
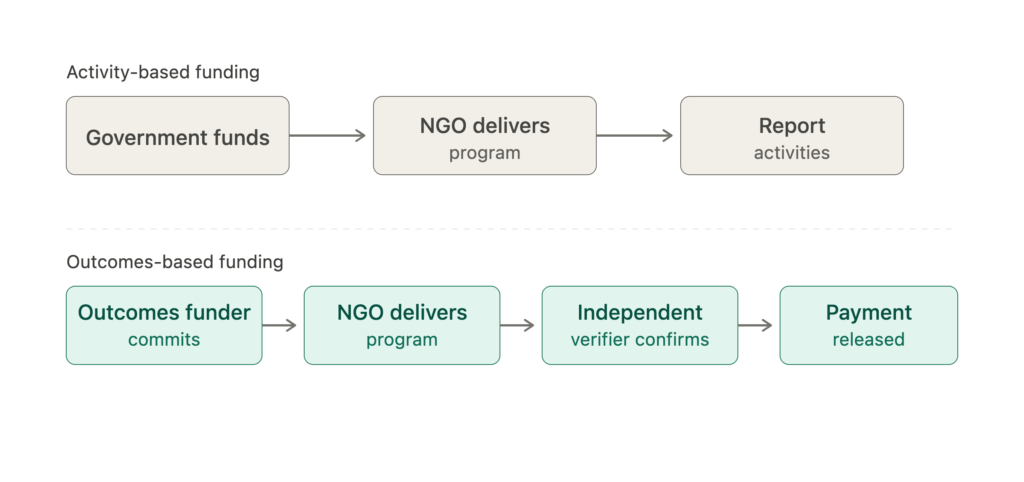
“Under outcomes-based contracting, payment is released only after an independent verifier confirms that pre-agreed results have been achieved.”
She cited the Ethiopian education minister who publicly announced that only 5% of students had passed the national school-leaving exam under rigorous assessment, after years of reported pass rates around 80%. “That kind of courage is what’s needed,” Karboul said. “Most ministers I work with know the real numbers are worse than the reported ones. Very few say it out loud in an international forum.” This account aligns with reporting on Ethiopia’s national examination pass rate collapse, which generated significant debate about the accuracy of prior results.
The UK’s recently announced Better Futures Fund, a £500 million commitment to outcomes-based programs for children and families, is one example of a government making that commitment at scale. Colombia has also developed a growing outcomes-based contracting ecosystem across several social sectors. But these are exceptions. Most development spending globally still flows through activity-based frameworks, where the accountability question is “did we do it?” rather than “did it work?”
Karboul’s book, “Better Lives, Better Spending,” written during a residency at the Rockefeller Foundation’s Bellagio Center, addresses that gap directly for practitioners and policymakers. The book is currently under contract with a publisher. The argument is not that outcomes-based financing is the only tool. It is that the default tool, measuring inputs and activities while assuming outputs will follow, has produced enough evidence of failure that continuing without questioning the accountability framework is hard to justify.
That argument extends beyond education. The same measurement gap that allows a job training program with a 15% sustained employment rate to be reported as a success exists in health, housing, and criminal justice. Outcomes-based contracting is not a universal solution, but it is a serious attempt to ask the question that price-per-beneficiary accounting is specifically built not to answer.
Listen to the full conversation with Amel Karboul at sri360.com/podcast/amel-karboul/. For more on impact measurement, development finance, and responsible investing, visit sri360.com/podcast/.